The Question
Markets rarely feel expensive while they are rising. Money is easy, the stories are good, and prices drift up quietly. So the question is: are investors buying real growth, or paying today for returns they would otherwise get tomorrow? If price says anything about the long run, expensive markets should lead to lower returns later. That is what the CAPE ratio tests.
What CAPE Measures
The Cyclically Adjusted Price-to-Earnings (CAPE) Ratio, or Shiller's PE, divides the market's price by its average inflation-adjusted earnings over the past 10 years. A decade smooths out booms and recessions, which make any single year's earnings misleading. A high CAPE means paying more for each rupee of long-run earnings. A low one means equities are cheap against what they have historically earned.
Where India Stood
The last month with full 10-year returns after it is February 2016. In January 2016, a month before, CAPE was about 19.1, around the 28th percentile of its range: cheaper than much of the past, but not the deep discount of a crisis. Indian valuations move in clear cycles: cheap when money is tight and investors are nervous, expensive when money is easy and optimism drives big rallies.
Today's market sits in the most expensive fifth of its own history.
10-year cyclically adjusted P/E of the Nifty 500, monthly. The shaded bands are the cheapest and dearest fifths of the years over which forward returns can be measured, and the next 3 charts are built on them.

CAPE, price to 10-year average real earnings
Cheapest fifth: below 18
Most expensive fifth: above 32.1
January 2026: 38.9, well inside the band that has delivered the weakest returns
Nifty 500 CAPE 10, monthly · Apr 2006 to Jan 2026
When Markets Get Pricey, What Comes Next?
History is split into five groups, from Q1 (the cheapest periods) to Q5 (the most expensive periods) by CAPE level.
The cheaper the market when you bought, the more it paid you after.
Every month from April 2006 to February 2016 sorted into 5 groups by starting CAPE, and the average annual return the Nifty 500 delivered over the 5 and 10 years that followed.
AVERAGE ANNUALISED TOTAL RETURN, PER CENT
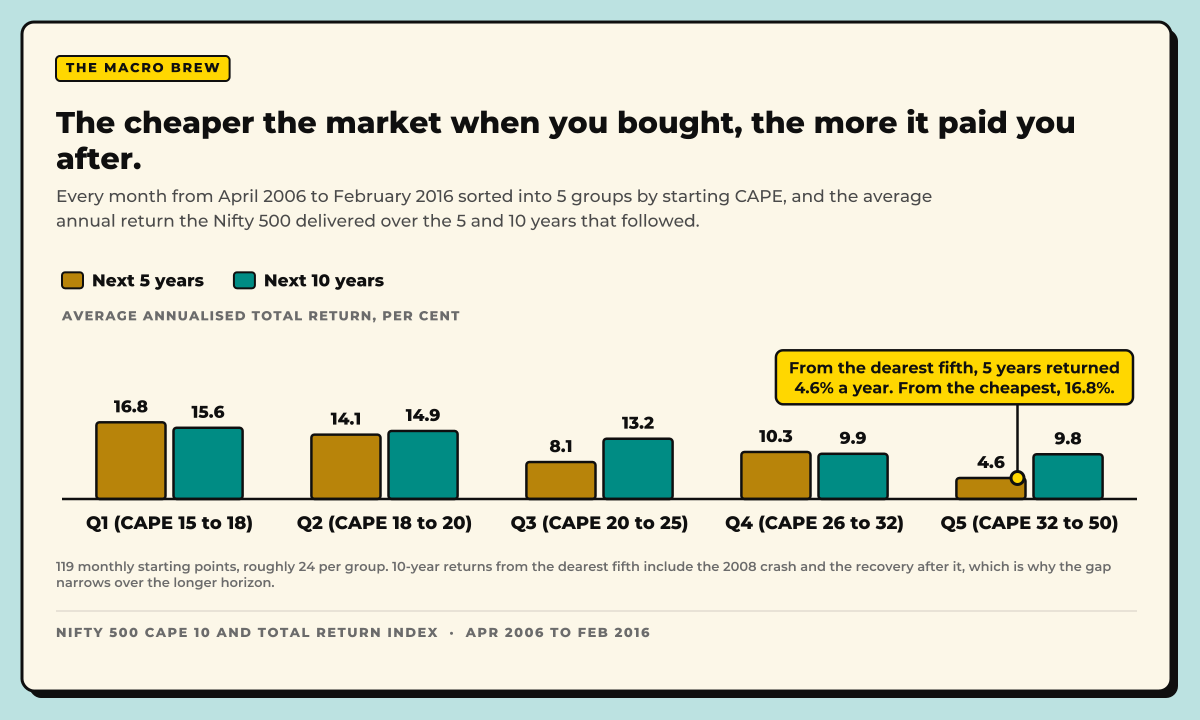
From the dearest fifth, 5 years returned 4.6% a year. From the cheapest, 16.8%.
119 monthly starting points, roughly 24 per group. 10-year returns from the dearest fifth include the 2008 crash and the recovery after it, which is why the gap narrows over the longer horizon.
Nifty 500 CAPE 10 and Total Return Index · Apr 2006 to Feb 2016
The pattern is clear. Buying in the cheapest fifth (Q1) gave the strongest forward returns: about 16-17% a year over the next 5 years and about 15-16% over the next 10. Returns fall step by step as valuations rise. Buying in the most expensive fifth (Q5) gave about 4-5% over 5 years and about 10% over 10.
The 10-year gap between the cheapest and dearest markets averages 5.8 points per year, and over decades that difference compounds into a very large gap in wealth. Why this matters: the price you start at shapes what you earn.
Against 5-year returns, the regression line slopes down: higher starting valuations mean lower future returns.
Every point of CAPE paid up front came out of the next 5 years.
One dot per month, April 2006 to February 2016: the starting valuation against the annualised total return over the following 5 years. The fit explains 61% of the spread.

Across: CAPE at the start · Up: Annualised return over the next 5 years · 119 observations
Each extra point of CAPE, 0.49% a year less over the next 5 · r² 0.61 · Bought at the December 2007 peak, the index had gone nowhere 5 years later
Nifty 500 CAPE 10 and Total Return Index · Apr 2006 to Feb 2016
Over 10 years the link is even clearer, because shorter horizons are pushed around more by shocks and cycles.
Stretch the horizon to 10 years and valuation still sets the ceiling.
The same starting months, with returns measured over the following decade. The slope is gentler because 10 years has more time to average out a bad entry, but the ordering holds and the fit is tighter.

Across: CAPE at the start · Up: Annualised return over the next 10 years · 119 observations
Each extra point of CAPE, 0.27% a year less over the next 10 · r² 0.64 · Even from the 2007 peak, a decade returned 7% a year. From the cheapest fifth, twice that.
Nifty 500 CAPE 10 and Total Return Index · Apr 2006 to Feb 2016
Why High Prices Can Stay High
Expensive does not always mean overdue for a fall. A lot depends on how much money is around. When the RBI cuts rates, banks and bonds pay less, so savers move into equities, and the more money flows in, the higher prices go. That is why markets usually do well when borrowing is cheap and struggle when that reverses.
India has an extra push: over the past decade, families have been moving savings out of gold, property and fixed deposits into mutual funds and SIPs, which sends a steady stream of domestic money into stocks every month.
Prices can also stay high because investors expect much bigger profits from big shifts like new technology, reforms or population trends, such as today's excitement about artificial intelligence. The longest stretches of high valuation come when easy money, strong growth expectations and a widely believed story all feed each other, keeping prices up far longer than seems reasonable. But when those assumptions crack, prices can fall just as far as they rose.
Sources
Every figure comes from IIM Ahmedabad's India CAPE data and NSE's index returns.
Data
- IIM Ahmedabad, India CAPE Data Resource, Nifty 500 CAPE 10, monthly
- IIM Ahmedabad, india_cape.csv, Monthly India CAPE Estimates, April 2006 onward
- NSE Indices, Historical Data, Total Returns Index
- Investing.com, Nifty 500 TRI Historical Data
- Robert Shiller, Online Data, U.S. Stock Markets 1871-Present and CAPE Ratio
Research papers
- NBER, Campbell and Shiller, Valuation Ratios and the Long-Run Stock Market Outlook: An Update, April 2001
- SSRN, Jacob and Raju, Forecast or Fallacy? Shiller's CAPE: Market and Style Factor Forward Returns in Indian Equities, July 2024
Official releases