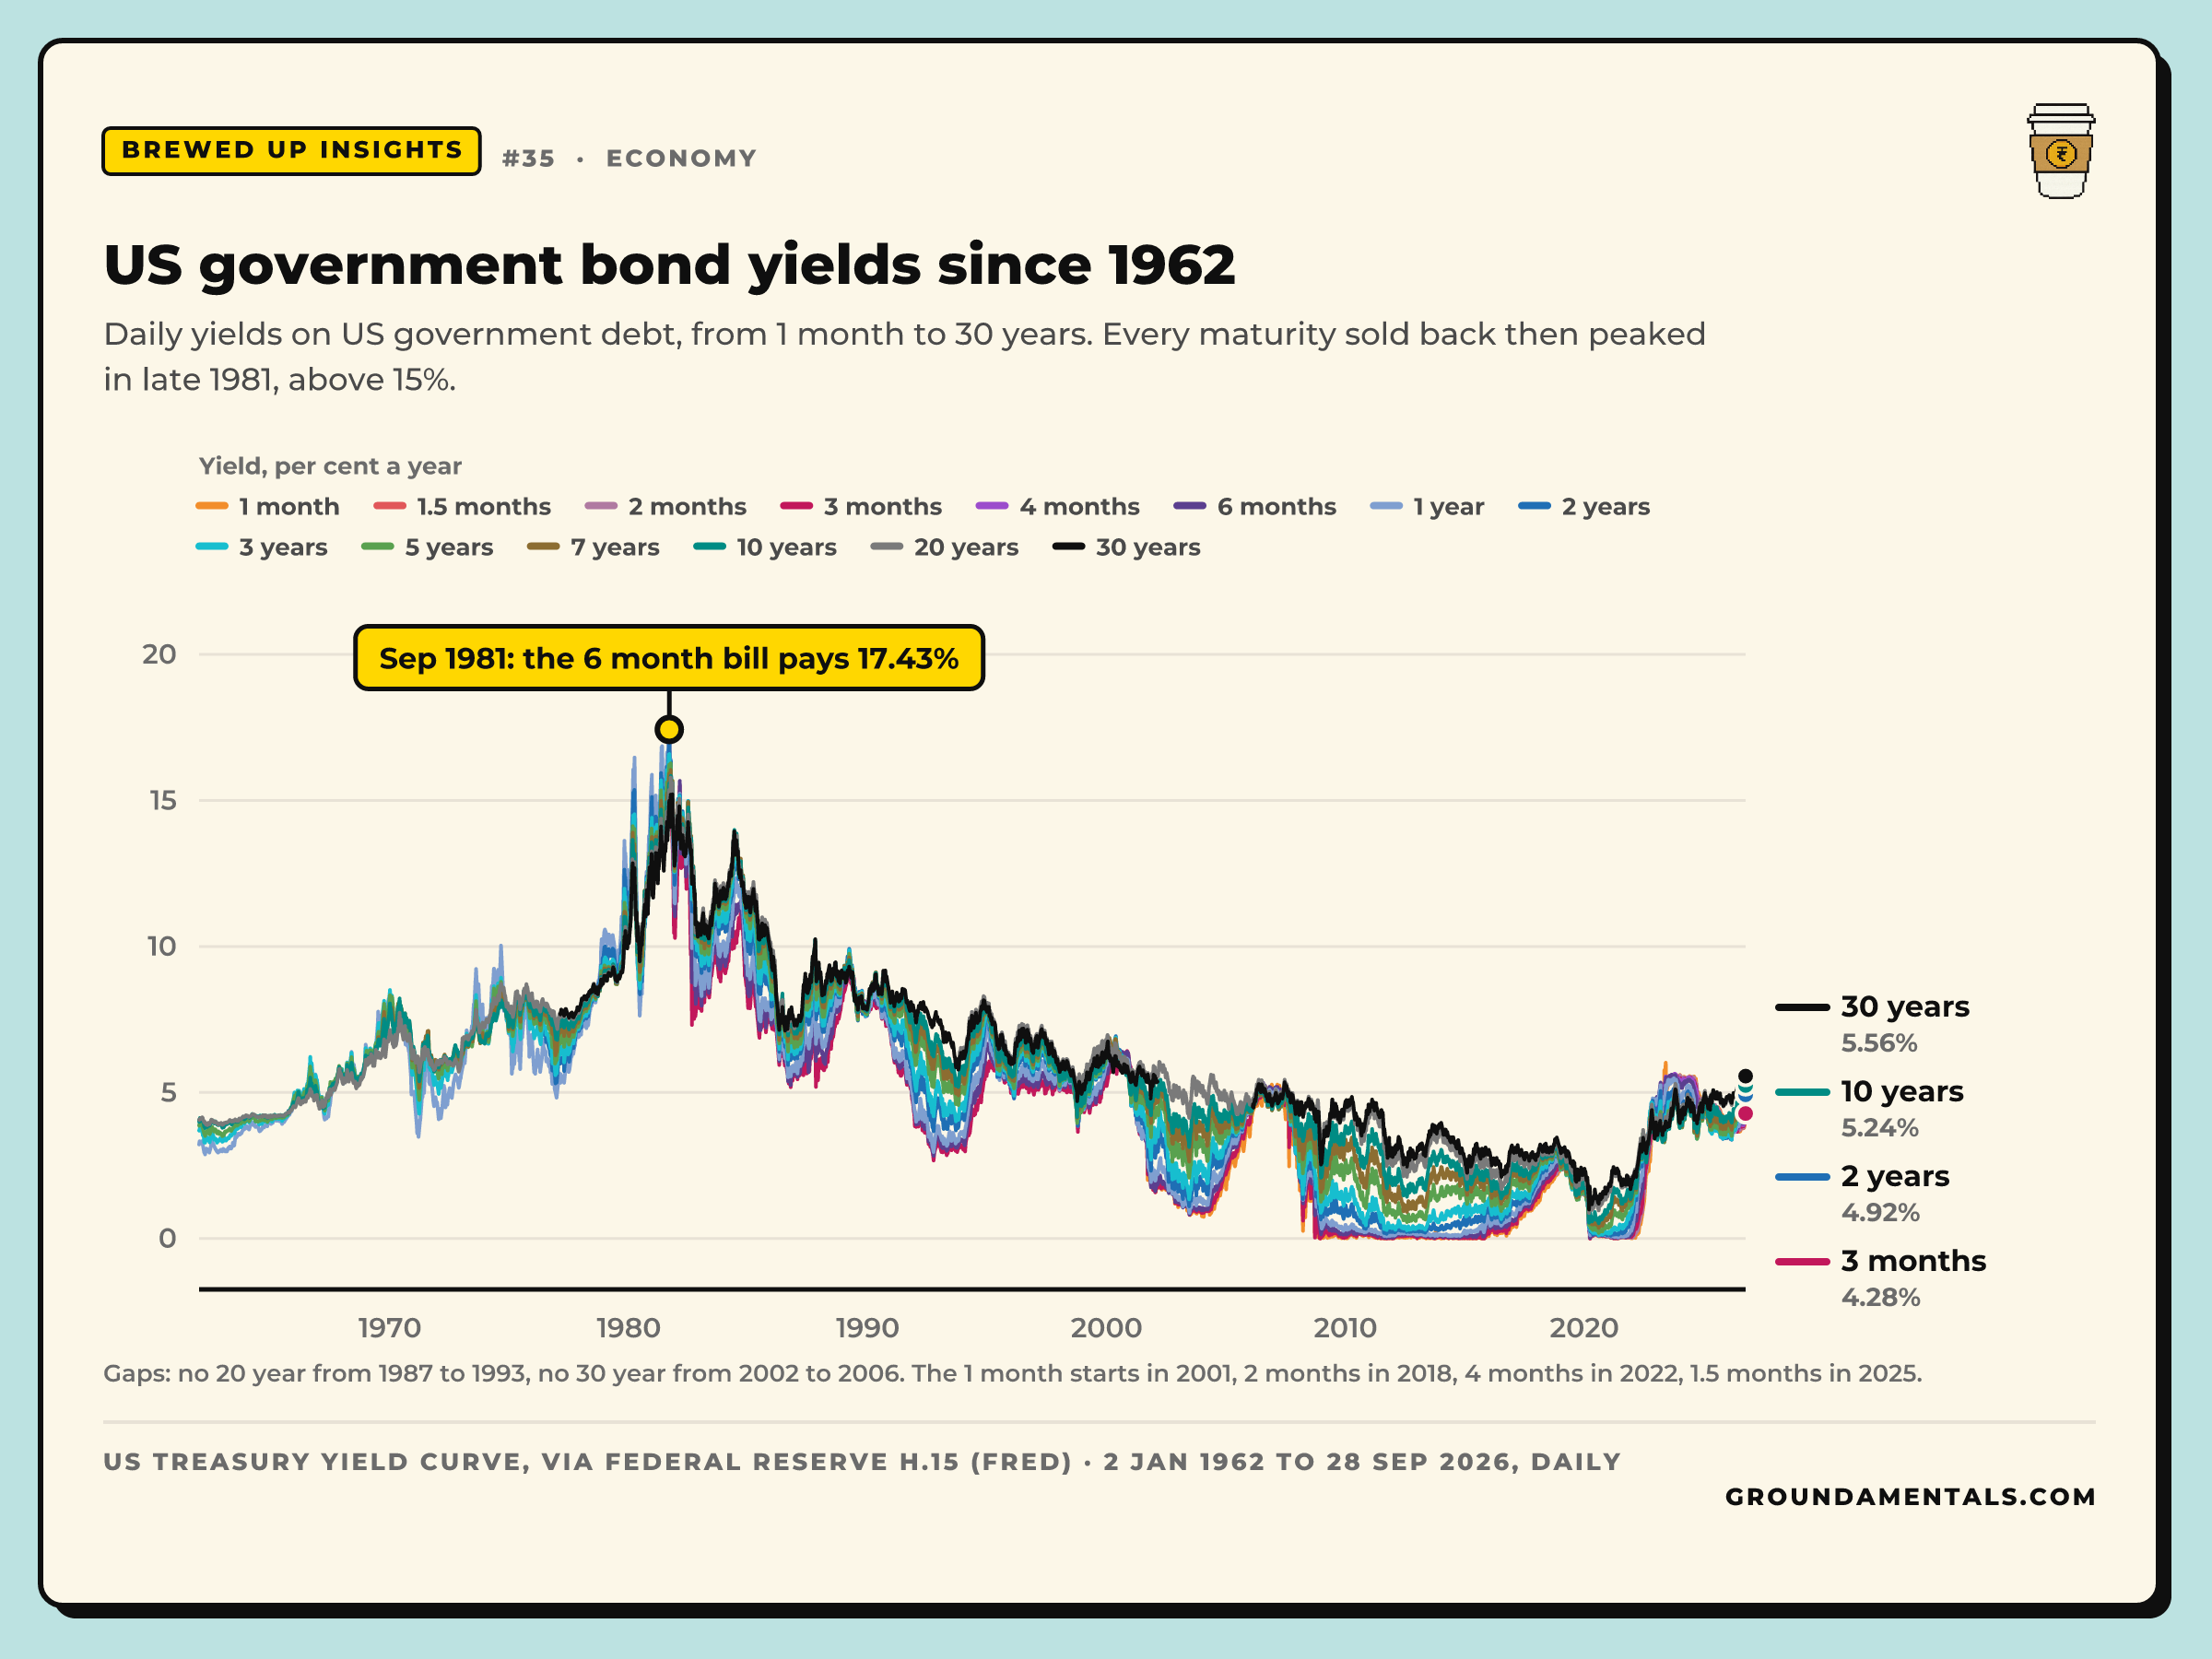
US government bond yields since 1962
Daily yields on US government debt, from 1 month to 30 years. Every maturity sold back then peaked in late 1981, above 15%.
US government bond yields since 1962
Daily yields on US government debt, from 1 month to 30 years. Every maturity sold back then peaked in late 1981, above 15%.

Yield, per cent a year
Sep 1981: the 6 month bill pays 17.43%
Gaps: no 20 year from 1987 to 1993, no 30 year from 2002 to 2006. The 1 month starts in 2001, 2 months in 2018, 4 months in 2022, 1.5 months in 2025.
US Treasury yield curve, via Federal Reserve H.15 (FRED) · 2 Jan 1962 to 15 Oct 2026, daily
Share it
The numbers
Embed it on your site
The code carries a credit line that links back to this page. Keep it with the chart.
From the insight
Sources
- FRED DGS1MO: 1 month Treasury constant maturity yield, daily
- US Treasury daily par yield curve rates, 2026 (1.5 month column)
- FRED DGS3MO: 3 month Treasury constant maturity yield, daily
- FRED DGS6MO: 6 month Treasury constant maturity yield, daily
- FRED DGS1: 1 year Treasury constant maturity yield, daily
- FRED DGS2: 2 year Treasury constant maturity yield, daily
- FRED DGS3: 3 year Treasury constant maturity yield, daily
- FRED DGS5: 5 year Treasury constant maturity yield, daily
- FRED DGS7: 7 year Treasury constant maturity yield, daily
- FRED DGS10: 10 year Treasury constant maturity yield, daily
- FRED DGS20: 20 year Treasury constant maturity yield, daily (not published 1987 to 1993)
- FRED DGS30: 30 year Treasury constant maturity yield, daily (discontinued 18 Feb 2002, reintroduced 9 Feb 2006)