When the US yield curve turned upside down
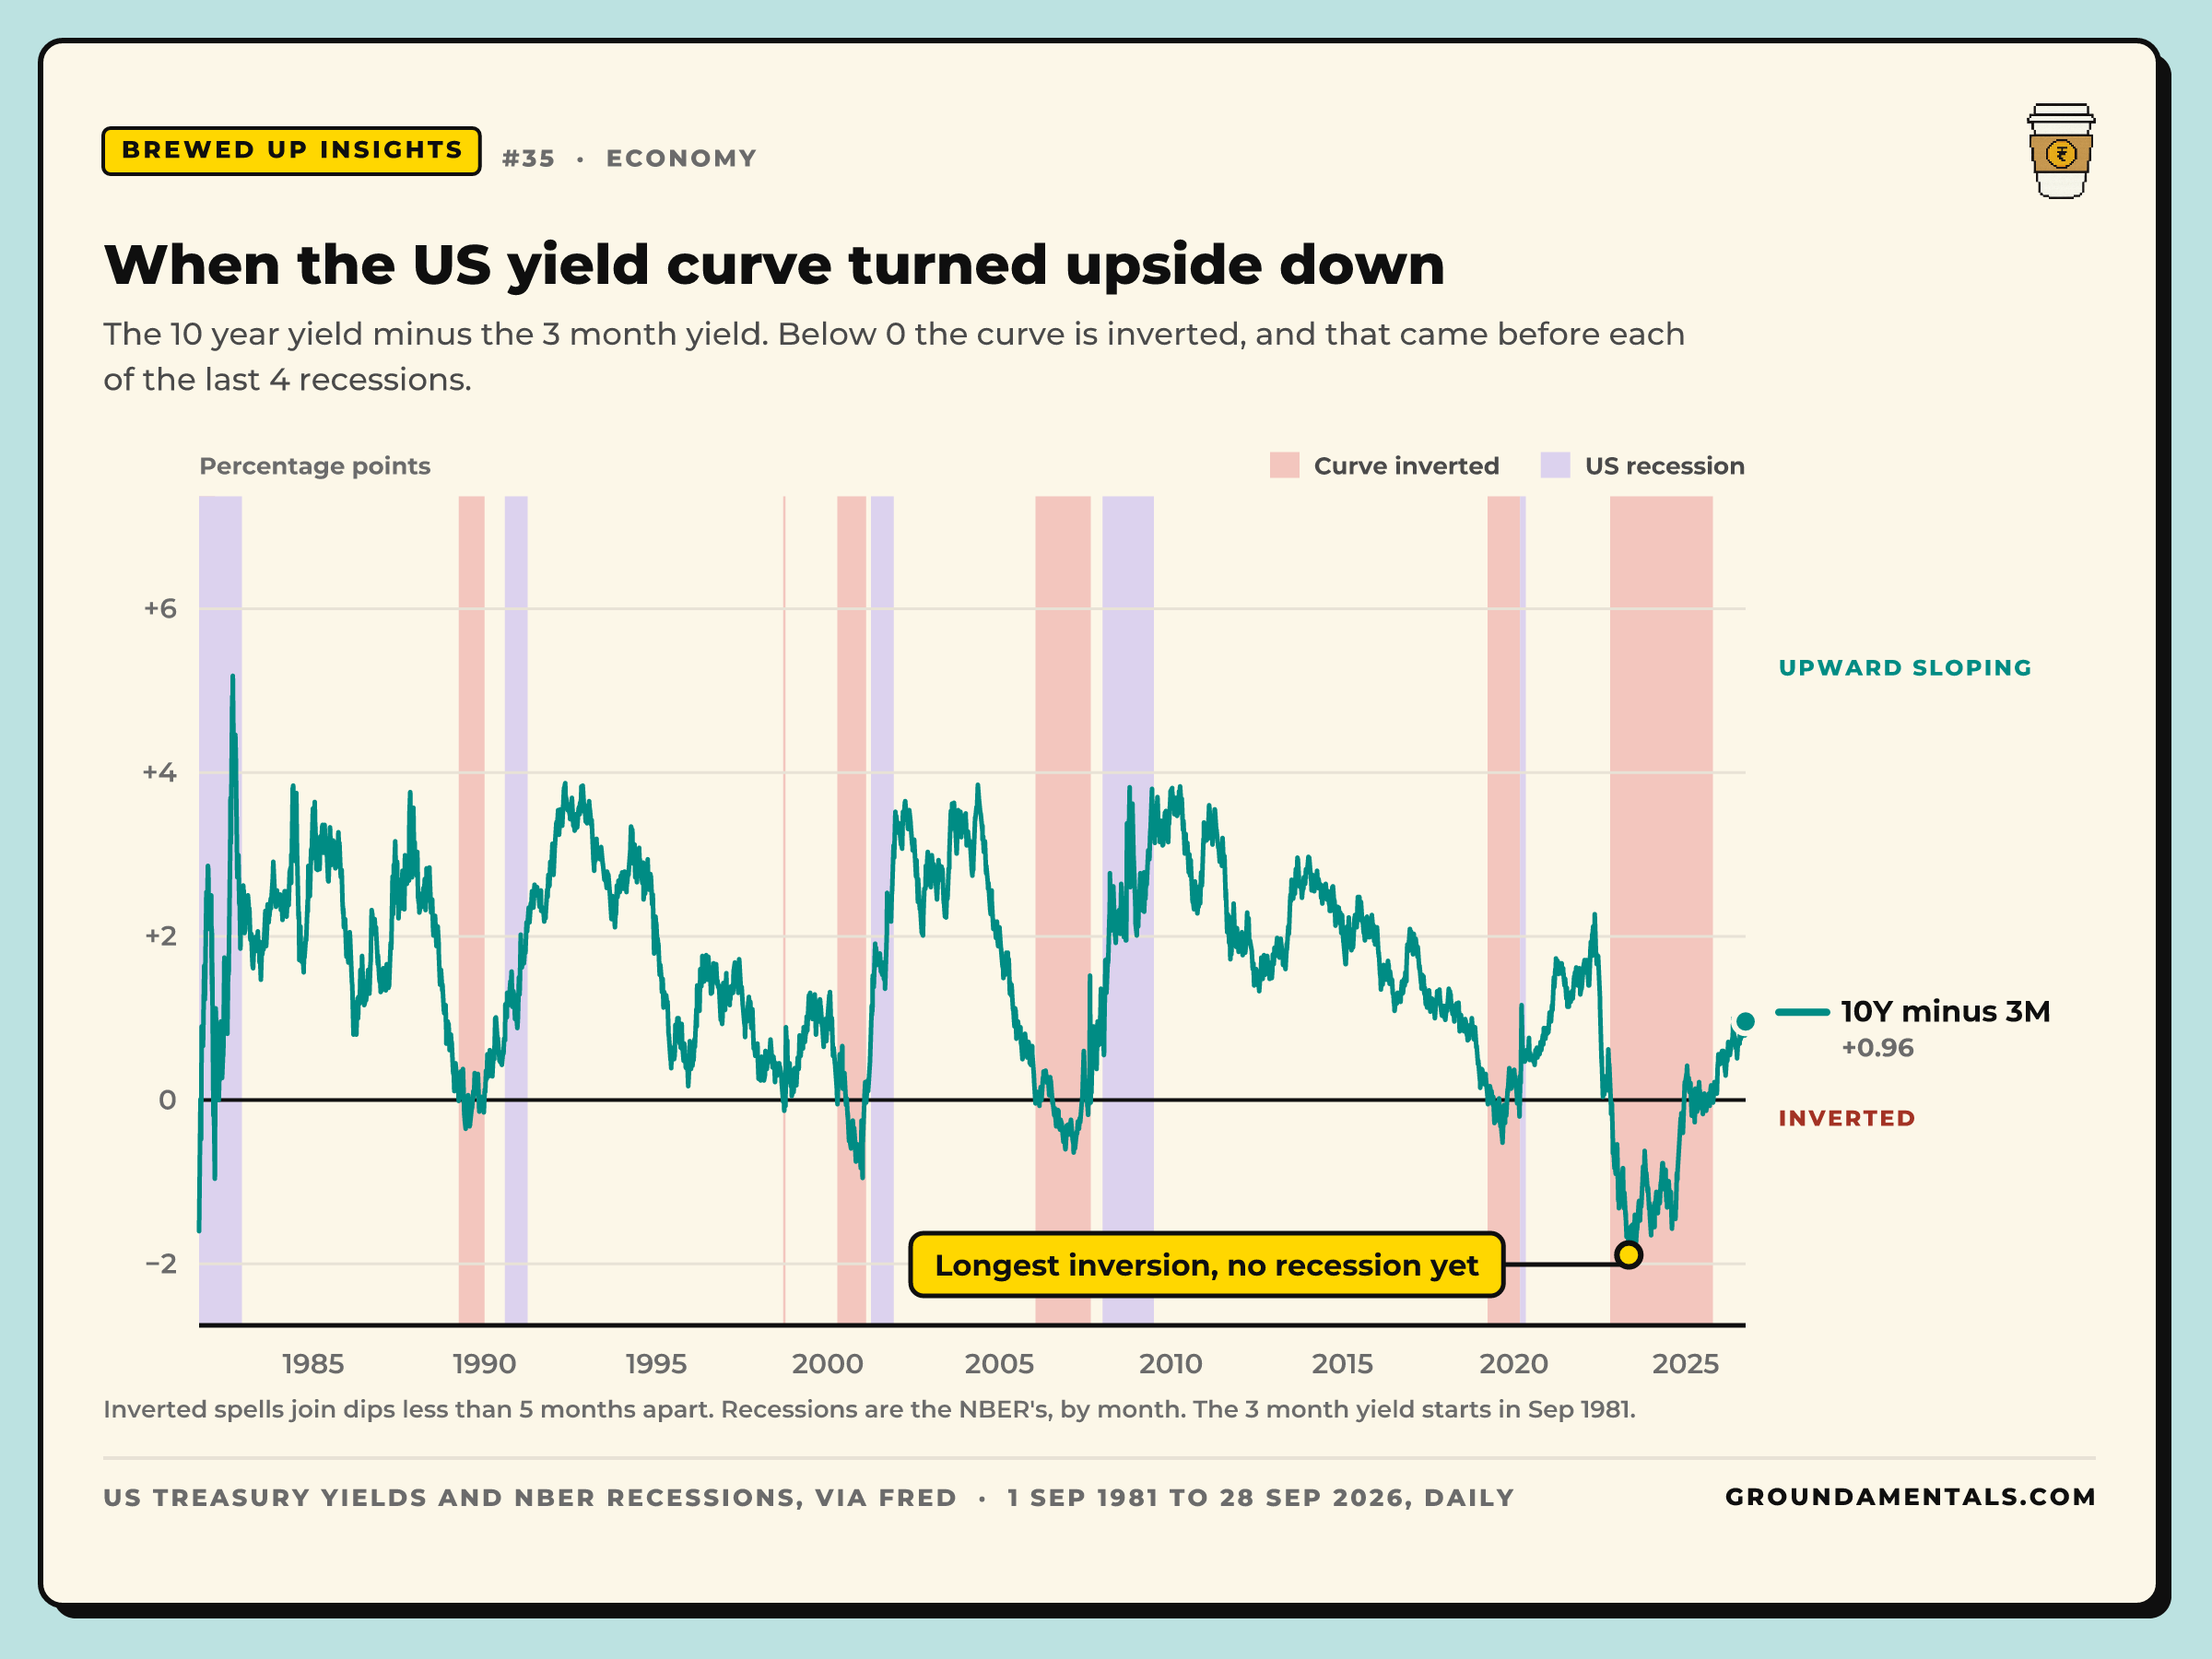
The 10 year yield minus the 3 month yield. Below 0 the curve is inverted, and that came before each of the last 4 recessions.
When the US yield curve turned upside down
The 10 year yield minus the 3 month yield. Below 0 the curve is inverted, and that came before each of the last 4 recessions.

Percentage points
Upward sloping: above 0
Inverted: below 0
Curve invertedUS recession
Longest inversion, no recession yet
Inverted spells join dips less than 5 months apart. Recessions are the NBER's, by month. The 3 month yield starts in Sep 1981.
US Treasury yields and NBER recessions, via FRED · 1 Sep 1981 to 15 Oct 2026, daily
Share it
The numbers
Embed it on your site
The code carries a credit line that links back to this page. Keep it with the chart.
From the insight
Sources
- FRED DGS10: 10 year Treasury constant maturity yield, daily (the spread is this less DGS3MO)
- FRED DGS3MO: 3 month Treasury constant maturity yield, daily
- FRED USREC: NBER based recession indicator, monthly (the grey bands)
- US Treasury daily par yield curve rates, 2026 (28 Sep to 15 Oct, newer than FRED)